Milestone 5: Final Report, Spatial Database Design, Temple University
by Stephen Baron, 27 April 2022
1. Dataset
This dataset is “Oil and Gas Wells Table, California” (https://gis.conservation.ca.gov/portal/home/item.html?id=0d30c4d9ac8f4f84a53a145e7d68eb6b), with 241,017 rows of data about individual wells across the state.
The data is in the coordinate reference system WGS 1984 (4326) (contrary to the data dictionary, by uploading the data to QGIS, it reveals the data is in 4326, not 3857 WGS84 Pseudo-Mercator). During the project, the data will be transformed into 3310 California Alberts NAD1983 in feet.
This dataset is is produced by the Geologic Energy Management Division (CalGEM), formerly the Division of Oil, Gas, and Geothermal Resources (DOGGR); much of the data still references DOGGR. CalGEM oversees the drilling, operation, maintenance, and plugging and abandonment of oil, natural gas, and geothermal energy wells. CalGEM’s authority extends from onshore to three miles offshore. [1]
California’s oil production began in the late 1800s. CalGEM was formed in 1915 to ensure the safe development and recovery of energy resources. CalGEM’s authority extends from onshore to three miles offshore. [1]
While California is a top-10 oil-producing state, the state has also seen production decline since the 1980s. Furthermore, CalGEM is driving California’s goals to become carbon-neutral by 2045, seemingly at odds with continuing oil and gas exploration and pumping. [1]
California approved more new wells in March and April 2022 than in any two-month period since October 2021. News reports cited increased demand for oil and gas due to due to the Ukraine war, and the federal government opening more public land to energy drilling. [2]
This dataset can be used for many analyses, such as identifying different types of wells, their status, location, and when they were drilled. Among the uses are one could identify where new wells should be drilled, or where old wells should be plugged or re-activated, or also do an analysis of well ownership.
This dataset is ideally used in conjunction with other datasets, such as US Census data. For example, though it’s beyond the scope of this assignment, one could analyze the wells in relation to high-risk communities of color or high poverty. One recent study shows that historically redlined neighborhoods are burdened by excess oil and gas wells, leading to pollution and public health issues. [3]
This research report will analyze 3 questions:
1) Which are the well ids, owners, status, locations, and distance in miles of the 5 nearest wells to the intersection of Hollywood and Vine?
Question #1 shows the extent to which oil and gas wells permeate even the most touristic intersections in California. Question #1 also includes using the PostGIS TIGER (Topologically Integrated Geographic Encoding and Referencing system) Geocoder, which turns the intersection into geographic coordinates. TIGER Geocoding involves downloading US Census road datasets of the US and California.
2) Find the distance in miles from the wells in the northernmost county of Siskiyou, to the nearest well in the southernmost county of San Diego.
Question #2 shows the state-wide extent of wells, and could support further oil and gas pipelines.
3) In light of rising demand for natural gas, which 10 new or active dry gas wells are closest to Los Angeles county? Do not include wells in Los Angeles county. List the well id, operator name, well status, well type, and county name.
Question #3 shows the potential for optimizing natural gas wells near Los Angeles to meet rising energy demand, and also outside of Los Angeles county’s boundaries.
2. Structure of the Data and Normalization
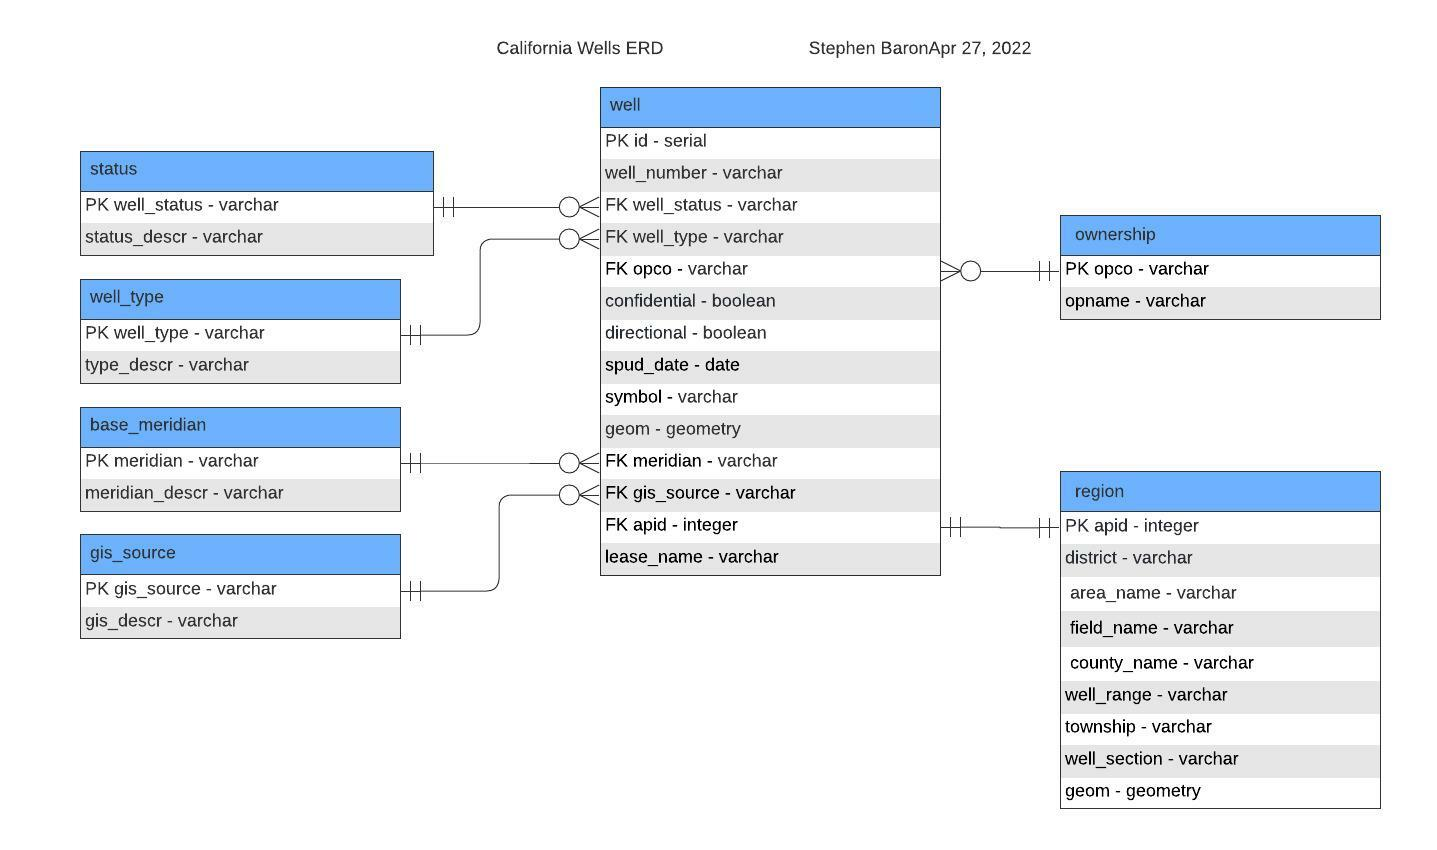
Table #1: status – This has two fields: well_status, a one-word primary key, and status_descr, which describes the status of the well. The Data Dictionary
well_status: There are 8 values in caallwells: Active, Buried, Canceled, Idle, New, Plugged, PluggedOnly, and Unknown. Three values (Buried, Canceled, and PluggedOnly) are not in the Data Dictionary, but are added based on caallwells.
status_descr: Based on the Data Dictionary descriptions.
Table #2: well_type – This is a two-letter code that indicates the well type. While the Data Dictionary lists only 14 well types, there are actually 19 values in the caallwells data set, below. There are only two fields: well_type, the primary key and the two-letter code, and the type_descr, the description.
(The Data Dictionary has only 14: AI, DG, DH, GD, GS, LG, OB, OG, PM, SC, SF, WD, WF, WS.)
Table #3: base_meridian – This is a short lookup table, which defines the base principle meridian for the Public Land Survey System (PLSS) and is required for all California surveys. There are only two fields: the meridian, the one-or-two letter primary key, and meridian_descr, which describes the meridian.
Table #4: gis_source – This is a short lookup table, which has a 3-letter code, gis_source, the primary key that describes the method by which the well location was established. There are only two fields: gis_source, the 3-letter code, and the gis_descr, which provides the description. There are 8 values.
There’s a discrepancy between the Data Dictionary and the caallwells data: The caallwells uses GPS, hud, mip, Notice of Intent to Drill, Operator, Unknown, and Well Summary, which are then standardized into 3-letter codes in gis_source, and also adds in DOQ – Digital Ortho Quad, which is in the Data Dictionary but not in the caallwells; DOQ may be used elsewhere in California state datasets.
Table #5: ownership – This short lookuptabledescribes the ownership of the wells. There are only two fields: opco (operatorco in caallwells, opcode in the Data Dictionary), a 5-digit unique identifier of letters and numbers that also serves as the primary key, and opname (operatorna in caallwells, opname in the Data Dictionary), which has the full name of the operating company.
Table #6: region – This table primarily relates to the geographic region in which the wells are located. There are 9 fields: apid, the primary key and a unique identifying integer given by the American Petroleum Institute (API).
There are additional identifying characteristics, which would be of primary interest to well owners: with the district (there are 4 distinct districts: Coastal, Inland, Northern, Southern), area_name (there are 212 distinct area names), field_name (there are 504 field names), county_name (there are 59 distinct counties: 58 of California’s counties, plus one for Los Angeles Offshore for offshore wells).
The next 3 fields – well_range, township, and well_section – are from the Public Land Survey System (PLSS). Raneg is the widest, there are 74 values. Township is second most general, there are 67 values. Section is the most specific, but they’re not unique identifiers, as different townships can have the same section. Unfortunately, these 3 fields are not specific enough to narrow down a well’s location, and cannot be combined to create a primary key, hence using the apid as a second unique well identifier.
The final value, geom, is a geographic point for the well, based on latitude and longitude from caallwells.
Table #7: well – The central table, which contains most of the identifying information about the wells. Among the fields, well id is the primary key, a serial number generated when importing from QGIS.
There are 6 foreign keys: well_status (linking to the status table), well_type (linking to the well_type table), opco (linking to the ownership table), meridian (linking to the base_meridian table), gis_source (linking to the gis_source table), and apid (linking to the region table).
Among the remaining fields, well_number is likely a number given by the operating company, there are 99,479 distinct well numbers, not enough for a unique identifier for each well. There are two fields that are Boolean true/false values: confidential (if subsurface information is held confidential for 2 years) and directional (whether the well was directionally drilled or not).
Additionally, spud_date is the date in which the well was drilled. As many fields are blank, due to incomplete data for older wells, blank text is converted into null in the SQL script below.
The field symbol is a combination of well_type and status, and geom is a geometry created from the latitude and longitude in caallwells. The field lease_name is either given by the State or by the operating company, there are 20,500 distinct lease names; not enough for a unique identifier.
3. Optimizations
This research report does not include index construction. There is one instance of denormalization, and that is including geometry in both the well and region tables. This is done for Question #2, to calculate distance between wells in the state, as one uses well id and one uses region apid.
4. Three Analytical Queries

Question #1. Which are the well ids, owners, status, locations, and distance in miles of the 5 nearest wells to the intersection of Hollywood and Vine? This shows how prevalent oil and gas wells are in California, even near a major tourist spot.
First, upload the California geocoder data set. There’s an in-depth process to install the PostGIS TIGER geocoder, creating tiger and tiger_data schemas, granting usage, and downloading data directly from the US Census Bureau’s website. Then one has to create nation and state scripts for California, and set the path to those.
As the TIGER geocoder was already installed for a previous project, this skips to installing the California state dataset, so that one can get the geographic coordinates for Hollywood and Vine. The below format will bring up the top 5 results for Hollywood and Vine’s latitude and longitude. ZIP code is from Google Maps. */


The results show at least 10 wells within 0.5 miles, which is quite surprising, though 9 of them are plugged and 1 is idle.

Question #2. Find the distance in miles from the wells in the northernmost county of Siskiyou, to the nearest well in the southernmost county of San Diego.
This intends to show where wells are located throughout the state, and could also be used to support the development of oil and gas pipelines.

The construction b.id || ‘, Distance: ’ || is used to include both the well and the distance in the second column, which cannot be done otherwise. Here, one transforms both values into 3310, the NAD83 State Plane for California Albers, and divides by 5280 feet for miles.
One then orders the wells by geographic nearness using the KNN operator <->, here in the b.geom <-> a.geom, and limits them to one well each (limit 1).


Image 3: Location of all wells in Siskiyou county (the northernmost county) and San Diego county (the southernmost county).

Image 4: Locations of 2 wells in Siskiyou county and the nearest well in San Diego.
Question #3. In light of rising demand for natural gas, which 10 new or active dry gas wells are closest to Los Angeles county? Do not include wells in Los Angeles county. List the well id, operator name, well status, well type, and county name.


Of the 10 nearest wells, 9 are active and only 1 is new. Most of the wells are in northern California, in Sacramento County; or Colusa County or Glenn County, both of which are north of Sacramento. Kern County is closer to LA, in Bakersfield.

5. ETL Process and Appendices
a. Appendix A: How to Obtain and Load the Data
This dataset is “Oil and Gas Wells Table, California,” which is downloaded as a .csv from CalGEM: https://gis.conservation.ca.gov/portal/home/item.html?id=0d30c4d9ac8f4f84a53a145e7d68eb6b.
Once the dataset is downloaded, one can use QGIS to import it into DBManager. First, in DBeaver, create an sddfinal schema.
In QGIS, click on DB Manager, connect to PostGIS. Click on Import Layer/File, and connect to the universe database (dbname=‘universe’, host=localhost, port=5432, sslmode=disable, username: postgres, password: postgres). Import this .csv as caallwells into the sddfinal schema. Primary key: id, geometry column: geom, source/target SRID: 4326. Convert field names to lowercase.
In DBeaver, set the search path to the sddfinal schema, public, and postgis. The caallwells table has 241,017 rows of data about onshore and offshore wells across California. One can check this by selecting all on the caallwells table.
c. Appendix C: Denormalization and Index
The only instance of denormalization is in having the geometry field in both well and region tables.
d. Appendix D: Data Dictionary
Datasets: “Oil and Gas Wells Table, California.” .csv file. Created: 5 August 2020.
See also: CalGEM Data Downloads.
Source: California DOGGR = CA Division of Oil, Gas, and Geothermal Resource. Now CalGEM Geologic Energy Management Division. https://maps.conservation.ca.gov/doggr/index.html
Data Dictionary: https://maps.conservation.ca.gov/doggr/metadata/allwells.html
6. Works Cited
[1]. “Oil and Gas.” California Department of Conservation. 2022. https://www.conservation.ca.gov/calgem/Pages/Oil-and-Gas.aspx
[2]. Cantu, Aaron. “California oil and gas industry leans on political heavyweights to drill wells.” 22 April 2022. Sacramento News & Review. https://sacramento.newsreview.com/2022/04/22/california-oil-and-gas-industry-leans-on-political-heavyweights-to-drill-wells/
[3]. “Historically Redlined Neighborhoods Are Burdened by Excess Oil and Gas Wells.” 27 April 2022. Columbia Climate School. https://news.climate.columbia.edu/2022/04/27/historically-redlined-neighborhoods-are-burdened-by-excess-oil-and-gas-wells/

